
Sep 02, 2026
By Emily Martin
Apple Inc. sells smartphones, computers, tablets, wearables and related services. Its reporting categories reflect a business in which hardware and software work together, while financial disclosures group several individual products and services into broader categories.
|
Profile field |
Verified information |
|
Company |
Apple Inc. |
|
Founded / founders |
April 1, 1976; Steve Jobs, Steve Wozniak and Ronald Wayne. |
|
Headquarters |
One Apple Park Way, Cupertino, California, United States. |
|
Leadership, September 2, 2026 |
CEO: John Ternus; executive chair: Tim Cook; CFO: Kevan Parekh; COO: Sabih Khan. |
|
Exchange / ticker |
Nasdaq / AAPL. |
|
Principal products |
iPhone, Mac, iPad, Apple Watch, AirPods, Apple Vision Pro, and home products and accessories. |
|
Principal services |
App Store, cloud services, digital content, payments, advertising and AppleCare. |
|
Latest employee disclosure |
Approximately 166,000 full-time equivalents, September 27, 2025. |
Leadership information is time-sensitive. John Ternus became CEO effective September 1, 2026, while Tim Cook became executive chairman. Accordingly, older profiles identifying Cook as the current CEO are no longer suitable for this publication date.
Apple’s CEO history begins with Michael Scott, rather than co-founder Steve Jobs. Jobs first assumed the CEO title on an interim basis in 1997. The table records CEO terms separately from chairmanships and other executive positions.
|
Chief executive |
Period in office |
Historical context |
|
Michael Scott |
1977–1981 |
Apple’s first CEO. |
|
Mike Markkula |
1981–1983 |
Early investor who succeeded Scott. |
|
John Sculley |
1983–1993 |
Joined as president and CEO; later retained the chairmanship after the CEO transition. |
|
Michael Spindler |
1993–1996 |
Succeeded Sculley; replaced by Gil Amelio. |
|
Gil Amelio |
1996–July 1997 |
Resignation announced July 9, 1997. |
|
Steve Jobs |
September 16, 1997–August 24, 2011 |
Initially interim CEO; became permanent CEO in January 2000. |
|
Tim Cook |
August 24, 2011–August 31, 2026 |
Succeeded Jobs; became executive chairman when Ternus took over. |
|
John Ternus |
September 1, 2026–present |
Current CEO as of September 2, 2026. |
Period notes: Earlier terms are shown by year where an exact appointment date is not specified. “Present” means September 2, 2026. Following Amelio’s departure in July 1997, CFO Fred Anderson temporarily led the company before Jobs’ September interim appointment; this management transition is noted separately from the main CEO succession.
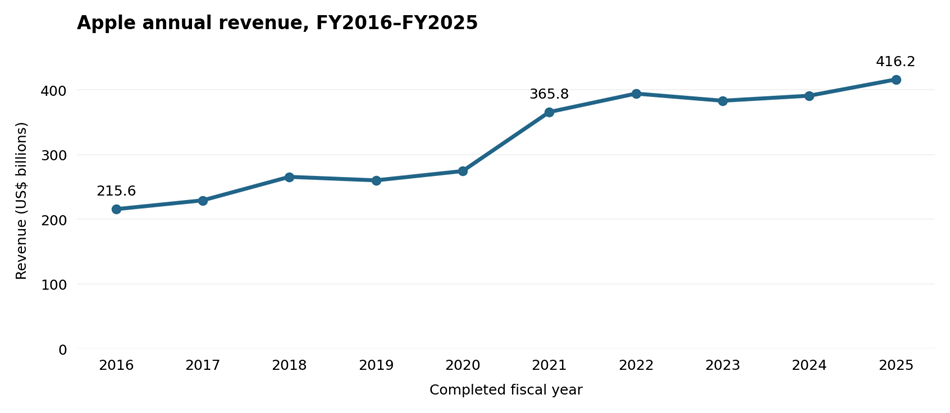
The following chart and underlying table use completed fiscal years only. Revenue is Apple’s reported net sales; growth is calculated from unrounded values in US$ millions.
|
Fiscal year |
Period end |
Revenue ($bn) |
YoY growth |
|
2016 |
Sep 24, 2016 |
215.639 |
-7.73% |
|
2017 |
Sep 30, 2017 |
229.234 |
+6.30% |
|
2018 |
Sep 29, 2018 |
265.595 |
+15.86% |
|
2019 |
Sep 28, 2019 |
260.174 |
-2.04% |
|
2020 |
Sep 26, 2020 |
274.515 |
+5.51% |
|
2021 |
Sep 25, 2021 |
365.817 |
+33.26% |
|
2022 |
Sep 24, 2022 |
394.328 |
+7.79% |
|
2023 |
Sep 30, 2023 |
383.285 |
-2.80% |
|
2024 |
Sep 28, 2024 |
391.035 |
+2.02% |
|
2025 |
Sep 27, 2025 |
416.161 |
+6.43% |
The series shows substantial expansion over the decade, interrupted by periods of contraction. Fiscal 2021 produced the largest annual increase in the displayed period. The subsequent pattern was less uniform: revenue fell in fiscal 2023 before returning to growth. A long-term upward trend should therefore not be interpreted as an uninterrupted annual growth rate.
Fiscal 2023 also contained an extra reporting week. That calendar difference matters when interpreting small changes against the adjacent years.
|
Metric |
FY2025 Q3 |
FY2026 Q3 |
YoY change |
|
Total revenue |
94.036 |
109.417 |
+16.36% |
|
Net income |
23.434 |
29.789 |
+27.12% |
|
iPhone |
44.582 |
54.252 |
+21.69% |
|
Mac |
8.046 |
10.352 |
+28.66% |
|
iPad |
6.581 |
6.191 |
-5.93% |
|
Wearables, Home and Accessories |
7.404 |
7.883 |
+6.47% |
|
Services |
27.423 |
30.739 |
+12.09% |
|
Net margin |
24.92% |
27.23% |
Not a growth rate |
The quarterly figures show stronger growth in iPhone and Mac than in iPad. They do not establish the result for the full fiscal year, and multiplying this quarter by four would ignore seasonality and product-launch timing.
Apple reported a 50.1% gross margin for the quarter, including approximately two percentage points of benefit from tariff refunds. That makes the reported margin an imperfect measure of underlying recurring profitability.
Fiscal 2025 net margin was 26.92%, calculated as net income divided by revenue. The comparison with fiscal 2024 requires care: Apple’s tax discussion identifies a substantial reduction in the tax provision associated with the European State Aid decision. Consequently, profit growth cannot be attributed entirely to improved product demand or operating efficiency.
|
Category |
FY2024 ($bn) |
FY2025 ($bn) |
FY2025 share |
YoY growth |
|
iPhone |
201.183 |
209.586 |
50.36% |
+4.18% |
|
Mac |
29.984 |
33.708 |
8.10% |
+12.42% |
|
iPad |
26.694 |
28.023 |
6.73% |
+4.98% |
|
Wearables, Home and Accessories |
37.005 |
35.686 |
8.58% |
-3.56% |
|
Services |
96.169 |
109.158 |
26.23% |
+13.51% |
|
Total |
391.035 |
416.161 |
100.00% |
+6.43% |
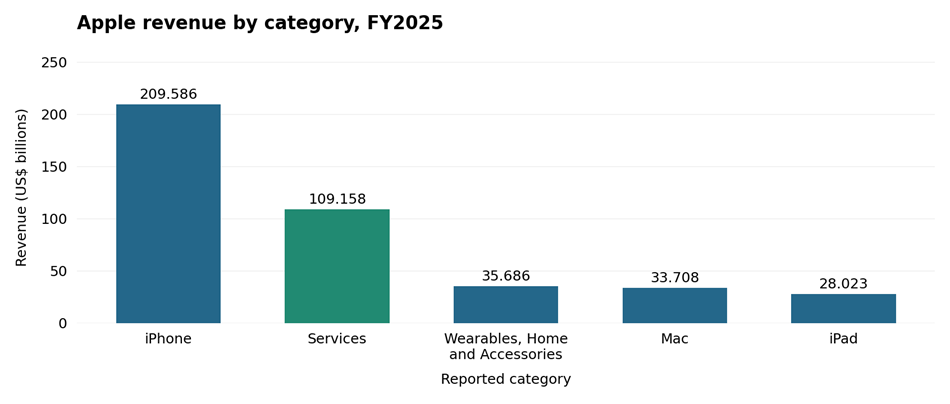
The mix illustrates why the iPhone remains central to Apple’s performance. Services provides a second large revenue stream, but Mac, iPad and the combined wearables category are also material businesses. The categories should be assessed individually: growth in one does not demonstrate that every product within it is expanding.
Standalone revenue for Apple Watch, AirPods, Vision Pro, Apple Music and iCloud is not publicly disclosed in Apple’s financial category tables. Assigning the entire wearables category to Apple Watch, or treating all Services revenue as subscription revenue, would materially misrepresent the business.
Annual iPhone revenue reached $209.586 billion in fiscal 2025, compared with $201.183 billion in fiscal 2024. Apple attributed the increase to higher revenue from Pro models. This supports a product-mix explanation, but does not reveal the separate contribution of prices and unit volumes.
The latest quarterly comparison is shown in the financial table above. Apple’s Q3 filing again identifies Pro models as the principal contributor to iPhone revenue growth.
|
Fiscal year |
iPhone ($bn) |
Services ($bn) |
|
2021 |
191.973 |
68.425 |
|
2022 |
205.489 |
78.129 |
|
2023 |
200.583 |
85.200 |
|
2024 |
201.183 |
96.169 |
|
2025 |
209.586 |
109.158 |
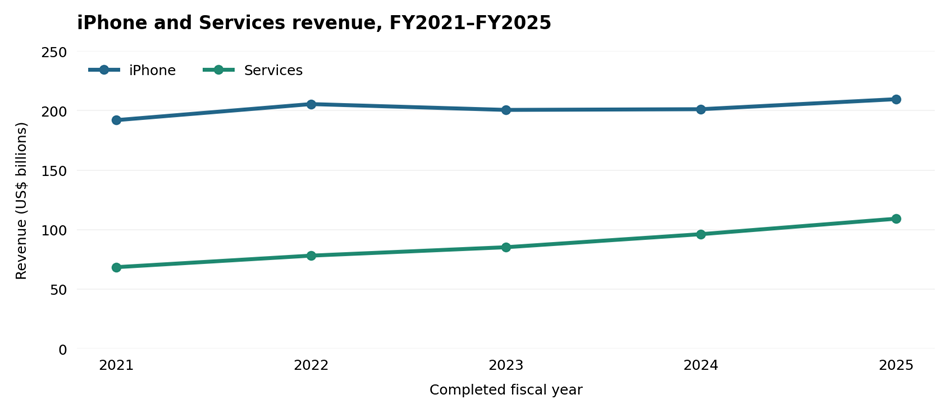
Services rises more consistently than iPhone across these observations. This suggests a progressively broader revenue base, while leaving Apple exposed to the health of its hardware ecosystem. The chart does not prove that a specific iPhone sale caused subsequent Services spending.
Omdia estimates that Apple shipped 240.6 million iPhones globally in calendar 2025, with provider-reported growth of approximately 7%. This measures shipments into distribution channels, rather than a company-disclosed count of final consumer purchases.
For calendar Q2 2026, Counterpoint reports Apple at 54% of US smartphone shipments, versus 30% for Samsung. The US result is far above Apple’s worldwide share, illustrating why a national statistic cannot be generalized globally.
In the global premium segment, Counterpoint estimates Apple held 65% of unit sales in the first half of 2026, against Samsung’s 19%. The provider defines premium as a wholesale average selling price of $600 or more; these are preliminary sales estimates, not retail-price thresholds or shares of all phones.
|
Fiscal year |
Mac ($bn) |
iPad ($bn) |
|
2022 |
40.177 |
29.292 |
|
2023 |
29.357 |
28.300 |
|
2024 |
29.984 |
26.694 |
|
2025 |
33.708 |
28.023 |
Mac and iPad revenue remained below their respective fiscal 2022 levels in fiscal 2025, despite their latest annual increases. This shows why a single year’s recovery is insufficient evidence of a sustained expansion cycle. Changes in model mix, launch timing and selling prices can also separate revenue performance from unit shipments.
For calendar Q2 2026, IDC estimates 6.7 million Mac shipments and 9.9% of the worldwide traditional PC market. Its preliminary tracker reports 10.1% shipment growth for Apple. Traditional PCs are a separate category from tablets.
Omdia estimates 13.459 million iPad shipments in calendar Q2 2026, giving Apple 37.8% of worldwide tablet shipments. Its table reports a decline of 7.5%, although the accompanying prose rounds the decline to 8%.
Apple can retain a leading shipment share while shipping fewer units when the overall market contracts. Conversely, rising Mac revenue alone does not establish an equivalent increase in Mac unit demand.
The combined category fell from $37.005 billion in fiscal 2024 to $35.686 billion in fiscal 2025, a calculated 3.56% decline. The latest quarter moved back into growth, as shown in the quarterly table. These are category results, not Apple Watch or AirPods revenue.
For calendar Q2 2026, Omdia estimates Apple held 46% of global smartwatch shipments. The provider’s broader wearable-band market also covers basic watches and bands, so it cannot be treated as synonymous with smartwatches. This market estimate does not measure Apple’s financial category revenue.
No unverified current AirPods shipment count is included. Similarly, a smartwatch dataset should not be combined with a broader wearable-device dataset that also includes fitness bands or audio products.
Services accounted for 26.23% of fiscal 2025 revenue, compared with 24.59% in fiscal 2024, based on author calculations. Its 75.4% gross margin in fiscal 2025 was materially above the 36.8% margin reported for Products. Gross margin deducts cost of sales; it is not a standalone Services operating margin.
In fiscal Q3 2026, Services gross margin was 75.6%. Apple’s filing identifies advertising and cloud services as the main contributors to quarterly Services revenue growth. It does not publish a complete revenue breakdown for each service.
Coverage of Apple’s July 30 earnings reported more than 1.5 billion paid subscriptions across its platform. This includes Apple services and qualifying third-party App Store subscriptions, rather than only subscriptions to Apple-owned offerings.
One person can hold several subscriptions. Therefore, the total cannot establish the number of Apple customers, Apple Music subscribers or Apple TV subscribers. Dividing overall Services revenue by this count would also fail to produce a meaningful average subscription price, because the numerator includes non-subscription activity.
An Apple-supported Analysis Group study estimates that the App Store ecosystem facilitated more than $1.4 trillion in developer billings and sales during calendar 2025. Its scope includes digital goods and services, physical purchases made through apps, and in-app advertising.
Apple’s accompanying release states that more than 90% of this activity generated no commission for Apple. The ecosystem figure consequently is not Apple revenue, App Store commissions, or developer proceeds after all costs. It measures a much broader set of economic transactions.
The study is useful for understanding app-enabled commerce, but its commissioned status and scope should remain visible. It should not be added to Apple’s financial revenue or used as a substitute for a disclosed App Store revenue figure.
|
Announcement date |
Active Apple devices |
|
February 2, 2023 |
More than 2.0 billion |
|
February 1, 2024 |
More than 2.2 billion |
|
January 29, 2026 |
More than 2.5 billion |
|
July 30, 2026 |
New record; no numeric total in release |
Apple’s July 2026 release described another installed-base record without providing a replacement numeric total. The January milestone remains the latest quantified figure verified in the accessible official releases used here; it is not an exact count as of September 2.
For iPhones specifically, Counterpoint’s calendar 2025 installed-base research places Apple above one billion active smartphones, representing nearly one in four active smartphones worldwide. The publicly accessible release does not provide an exact current iPhone count.
An active device is hardware in use. A user is a person, an account is a login identity, and a subscription is a paid relationship. A person can own multiple devices and subscriptions, while a device can have more than one user. None of these measures can be substituted for another without a documented methodology.
Installed-base growth and annual shipments can also move differently. A replacement purchase may retire an older device, while resale can keep that device active elsewhere. This makes retention and device longevity relevant to ecosystem scale, without implying that every active device generates recurring payments.
|
Segment |
FY2024 ($bn) |
FY2025 ($bn) |
FY2025 share |
YoY growth |
|
Americas |
167.045 |
178.353 |
42.86% |
+6.77% |
|
Europe |
101.328 |
111.032 |
26.68% |
+9.58% |
|
Greater China |
66.952 |
64.377 |
15.47% |
-3.85% |
|
Japan |
25.052 |
28.703 |
6.90% |
+14.57% |
|
Rest of Asia Pacific |
30.658 |
33.696 |
8.10% |
+9.91% |
|
Total |
391.035 |
416.161 |
100.00% |
+6.43% |
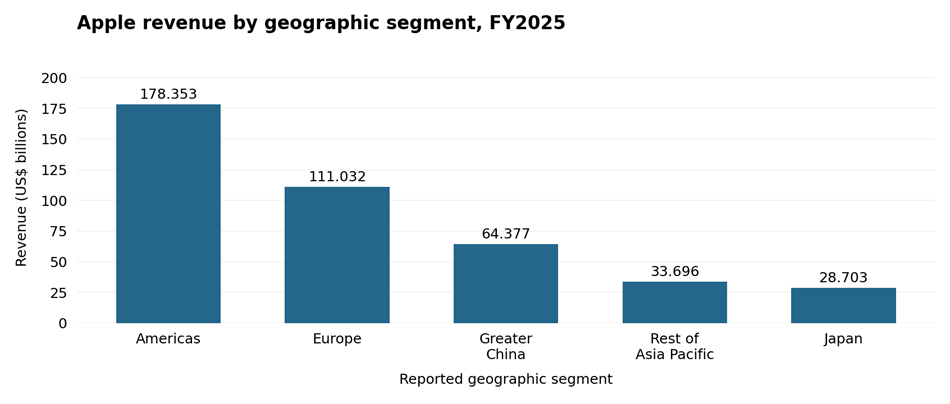
The Americas generated the most revenue. Greater China was the only reporting segment in this table to contract, while Japan recorded the fastest percentage growth. The findings describe reported US-dollar revenue, so they should not be interpreted as pure changes in local unit demand.
Apple’s definitions are broader than their labels may suggest. Americas includes North and South America. Europe includes India, the Middle East and Africa. Greater China includes mainland China, Hong Kong and Taiwan. Rest of Asia Pacific includes Australia, New Zealand and Asian countries outside the other segments.
For business planning, these distinctions matter: Apple’s Europe revenue is not a direct measure of European-country demand, and Greater China revenue is not mainland China smartphone sales.
|
Market / geography / period |
Comparable vendor shares |
Basis / provider |
|
Smartphones / worldwide / Q2 2026 |
Samsung 23%; Apple 21%; Xiaomi 11% |
Unit shipments / Counterpoint |
|
Smartphones / United States / Q2 2026 |
Apple 54%; Samsung 30%; Motorola 11% |
Unit shipments / Counterpoint |
|
Premium smartphones / worldwide / H1 2026 |
Apple 65%; Samsung 19% |
Unit sales; wholesale ASP ≥$600 / Counterpoint |
|
Traditional PCs / worldwide / Q2 2026 |
Lenovo 24.4%; HP 19.1%; Dell 13.6%; Apple 9.9%; ASUS 7.4% |
Unit shipments / IDC |
|
Tablets / worldwide / Q2 2026 |
Apple 37.8%; Samsung 16.3%; Lenovo 11.1%; Xiaomi 8.0%; Huawei 7.7% |
Sell-in unit shipments / Omdia |
All measures are unit-based third-party estimates. Shares are reproduced at provider precision; they are not recalculated from rounded shipment volumes. PC estimates and premium-smartphone estimates are preliminary. These rows compare vendors only within the same category, geography, period and provider.
Apple’s position varies sharply by market. It has a much larger share of US smartphone shipments and premium smartphone sales than of worldwide traditional PC shipments. That distinction is more informative than describing Apple as having one universal technology-market share.
Counterpoint’s full-year 2025 smartphone release reports 20% global shipment share for Apple, compared with 19% for Samsung. This is separate from Omdia’s annual unit estimate and should not be used to reverse-engineer Omdia’s total market size.
Operating-system web-usage measures are excluded from the hardware comparisons. A share calculated from browsing activity is affected by usage intensity and the websites measured; it does not count newly shipped phones or computers.
|
Fiscal year / period end |
R&D ($bn) |
R&D / revenue |
Employees (FTE) |
|
2021 / September 25 |
21.914 |
5.99% |
154,000 |
|
2022 / September 24 |
26.251 |
6.66% |
164,000 |
|
2023 / September 30 |
29.915 |
7.80% |
161,000 |
|
2024 / September 28 |
31.370 |
8.02% |
164,000 |
|
2025 / September 27 |
34.550 |
8.30% |
166,000 |
The table shows research spending rising more quickly than the reported workforce over the displayed period. It also shows why dividing total R&D by all employees would be misleading: the workforce includes roles outside research, and R&D contains costs other than salaries.
Apple does not disclose a complete AI-only spending figure. Its total R&D budget should therefore not be relabeled as AI investment, nor should announced multi-year spending commitments be treated as one year’s capital expenditure.
Apple opened its Advanced Manufacturing Center in Houston on August 13, 2026. The company said the same facility was already building and shipping AI servers, while Mac mini manufacturing was planned to begin later in the year. The latter remains a forward-looking operating plan in that announcement.
For environmental context, Apple reports that its 2025 greenhouse-gas emissions were more than 60% below its 2015 baseline across its reported footprint. The company said this reduction was broadly unchanged from 2024. The figure describes a historical reduction, not achievement of the separate goal to become carbon neutral across its footprint by 2030.
The latest quarter delivered revenue growth across iPhone, Mac and Services, while iPad declined. Apple’s July results release also highlighted its introduction of Siri AI at WWDC26. The announcement establishes a product initiative; it does not disclose a separate AI revenue stream or prove that AI drove the quarter’s sales.
Apple announced revised EU app business terms on August 18, 2026, with changes scheduled for October 1. This is relevant to future distribution economics. The announcement should not be treated as evidence that the new terms already affected the reported June quarter.
Company guidance: Reuters reported that CFO Kevan Parekh expected September-quarter revenue growth of 9%–11% and gross margin of 47%–48%. These were management’s July 30 expectations, not reported results. The same report identifies advanced-chip supply constraints as a business risk.
Independent forecast: IDC’s late-August outlook projects a 16.7% decline in worldwide smartphone shipments during calendar 2026. This is a market forecast, not Apple guidance, and later releases can revise it. No corresponding full-year Apple revenue forecast is inferred here.
The central question is whether Apple can sustain revenue growth while component costs, product availability and app-distribution economics change. A larger Services contribution provides diversification within the ecosystem, but it does not remove dependence on device adoption and customer spending.
Future reporting should be evaluated through comparable quarterly growth, margins excluding unusual benefits where disclosed, and provider-consistent shipment trends. Neither one strong quarter nor one adverse industry forecast is sufficient to establish Apple’s long-term growth rate.
Apple generated $416.161 billion in fiscal 2025, ended September 27, 2025. Its latest reported quarter, fiscal Q3 2026 ended June 27, produced $109.417 billion. These are different reporting periods; the quarterly figure is not a full-year 2026 result or a reliable annual run rate.
The iPhone contributed 50.36% of fiscal 2025 revenue, calculated from $209.586 billion in iPhone revenue divided by $416.161 billion in total revenue. The percentage varies between quarters and years. It measures revenue contribution, rather than the iPhone’s share of all Apple devices or customers.
Services generated $109.158 billion in fiscal 2025, representing a calculated 26.23% of Apple revenue. The category contains several activities and is broader than Apple-owned subscriptions. Apple does not provide a complete revenue breakdown for individual services such as Apple Music or iCloud in its category tables.
Apple announced more than 2.5 billion active devices on January 29, 2026. Its July release reported another record without a numerical update. The verified numeric milestone covers the ecosystem and should not be described as the number of people using Apple products or the number of active iPhones.
Apple does not disclose current annual iPhone unit sales in its financial category tables. Omdia estimates 240.6 million global iPhone shipments in calendar 2025. Shipments are an industry estimate of devices entering channels, not an Apple-reported count of end-user purchases. Calendar 2025 also differs from Apple’s fiscal 2025.
Counterpoint’s August 2026 update places Apple at 21% of global smartphone shipments in calendar Q2 2026. The same provider reports 54% in the US for that quarter. These are shipment-volume shares, distinct from smartphone revenue share, premium-segment sales share, installed-base share and operating-system web usage.
The Americas was Apple’s largest reporting segment in fiscal 2025, generating $178.353 billion, or a calculated 42.86% of total revenue. The segment includes both North and South America. It should not be presented as United States revenue, and its growth does not directly measure changes in unit shipments.
Apple reported approximately 166,000 full-time equivalent employees as of September 27, 2025. This is the latest annual employee disclosure used in this article. It is not a real-time September 2026 headcount and does not count all workers at suppliers, manufacturing partners, developers or other businesses supported by Apple-related spending.
Apple spent $34.550 billion on R&D in fiscal 2025, equivalent to a calculated 8.30% of revenue. This covers company-wide research and development. Apple does not provide a comprehensive AI-only breakdown, so the total should not be labeled as spending exclusively on artificial intelligence, chips or any other individual initiative.
A calendar year runs from January through December. Apple’s fiscal year is a 52- or 53-week period ending on the last Saturday of September. Fiscal 2025 ended September 27, 2025; fiscal Q3 2026 ended June 27, 2026. Always retain these labels when comparing financial results with calendar-based market research.
Apple’s disclosed results show a business still centered on iPhone, with Services providing a larger revenue contribution and higher gross margins. Its competitive position varies by device category and geography. The most useful assessment combines financial performance with clearly defined market estimates, while keeping devices, customers, subscriptions and ecosystem commerce separate. Supply conditions and changing distribution terms remain important areas to follow.

Market View Insights specializes in delivering comprehensive market research solutions across 120 industries.Detailed and insightful reports covering market trends, competitive analysis, consumer behavior, and more, providing valuable insights for informed decision-making.
 USA :India :
 sales@marketviewinsights.com
 +1-445-120-2050


 +1-445-120-2050


 Chemicals And Materials
 Consumer Goods
 Energy And Power
 Biotechnology
 Healthcare
 Medical Devices And Supplies
 Pharmaceuticals
 Food And Beverage
 Agriculture
 Automotive And Transportation
 Technology
 Semiconductors And Electronics
 Building And Construction
 Manufacturing
