
May 28, 2026
By Emily Martin
|
Profile Item |
Details |
|
Company Name |
The Coca-Cola Company |
|
Category / Industry |
Nonalcoholic beverages, total beverage company |
|
Company Type |
Public company |
|
CEO |
Henrique Braun, CEO effective March 31, 2026 |
|
CFO |
John Murphy, President and Chief Financial Officer |
|
Founder |
Dr. John S. Pemberton created the Coca-Cola drink in 1886; Asa G. Candler incorporated The Coca-Cola Company in 1892 |
|
Founded Year |
1886 for the Coca-Cola drink; 1892 for The Coca-Cola Company |
|
Headquarters |
Atlanta, Georgia, United States |
|
Stock Symbol |
KO |
|
Exchange |
New York Stock Exchange |
|
Number of Employees |
Approximately 65,900 employees as of December 31, 2025 |
|
Annual Revenue |
USD 47.941 billion in fiscal year 2025 |
|
Net Income |
USD 13.107 billion attributable to shareowners in fiscal year 2025 |
|
Total Assets |
USD 104.816 billion as of December 31, 2025 |
|
Products / Services |
Beverage concentrates, syrups, finished beverages, brand licensing, marketing, and beverage distribution support |
|
Key Brands |
Coca-Cola, Coca-Cola Zero Sugar, Diet Coke / Coca-Cola Light, Sprite, Fanta, Dasani, smartwater, Topo Chico, Powerade, BODYARMOR, Minute Maid, Simply, fairlife, Costa, Georgia, Gold Peak, and others |
|
Competitors |
PepsiCo, Keurig Dr Pepper, Monster Beverage, Red Bull, Nestle water brands, Danone, private labels, and regional beverage companies |
|
Subsidiaries |
Selected controlled businesses include Coca-Cola Refreshments USA, Costa, fairlife, innocent, dogadan, Minute Maid related businesses, and Bottling Investments operations |
|
Website |
https://www.coca-colacompany.com |
|
Geographical Presence |
More than 200 countries and territories through company operations, bottling partners, and licensed distribution systems |
The Coca-Cola Company is one of the largest beverage companies in the world and remains a major reference point for beverage industry performance in 2026. The company owns and markets a broad portfolio of nonalcoholic beverage brands, led by Coca-Cola, Sprite, Fanta, Coca-Cola Zero Sugar, Diet Coke / Coca-Cola Light, Minute Maid, Simply, fairlife, Powerade, BODYARMOR, Dasani, smartwater, Topo Chico, Costa, and other local and regional brands. Coca-Cola statistics are widely followed because the company operates across mature and emerging beverage markets and uses one of the largest bottling systems in consumer goods.
The company’s business model is built around beverage concentrates, syrups, finished products, licensed brands, global marketing, and a large bottling partner network. In 2025, Coca-Cola reported USD 47.941 billion in net operating revenue and USD 13.107 billion in net income attributable to shareowners. Full-year 2026 revenue is not available yet, so the most complete annual Coca-Cola revenue data remains fiscal year 2025.
Coca-Cola is important in 2026 because it combines a heritage brand with ongoing product, packaging, digital, and route-to-market changes. Its Q1 2026 results showed 12% reported net revenue growth to USD 12.5 billion, while unit case volume increased 3%. These figures indicate that the company entered 2026 with growth momentum across several beverage categories, although full-year performance will depend on pricing, consumer demand, currency movements, and execution by bottling partners.
This Coca-Cola facts article presents a structured view of company profile data, revenue statistics, regional results, product performance, sales facts, employee data, shareholder information, innovation activity, partnerships, website traffic, social media presence, recent developments, and future outlook. Each major data point is tied to official company filings, investor materials, company pages, or recognized public databases.
Coca-Cola revenue is reported as net operating revenue. The table below uses the latest complete annual data available through fiscal year 2025. Because full-year 2026 results are not yet available, Q1 2026 is discussed separately in the growth and recent developments sections.
|
Year |
Revenue |
YoY Change |
Key Reason |
|
2016 |
USD 41.863 billion |
N/A |
Pre-refranchising base year |
|
2017 |
USD 35.410 billion |
-15.4% |
Bottling refranchising and structural changes reduced reported revenue |
|
2018 |
USD 31.856 billion |
-10.0% |
Additional refranchising and mix changes affected reported revenue |
|
2019 |
USD 37.266 billion |
+17.0% |
Organic growth, acquired revenue, and a cleaner operating base lifted revenue |
|
2020 |
USD 33.014 billion |
-11.4% |
COVID-19 pressure reduced away-from-home consumption |
|
2021 |
USD 38.655 billion |
+17.1% |
Market reopening and stronger organic revenue supported recovery |
|
2022 |
USD 43.004 billion |
+11.3% |
Pricing, mix, and volume recovery supported growth |
|
2023 |
USD 45.754 billion |
+6.4% |
Favorable price/mix and concentrate sales growth supported performance |
|
2024 |
USD 47.061 billion |
+2.9% |
Price/mix benefits offset currency and structural pressures |
|
2025 |
USD 47.941 billion |
+1.9% |
Reported revenue rose 2%, supported by 4% price/mix and 1% volume, partly offset by currency and divestitures |
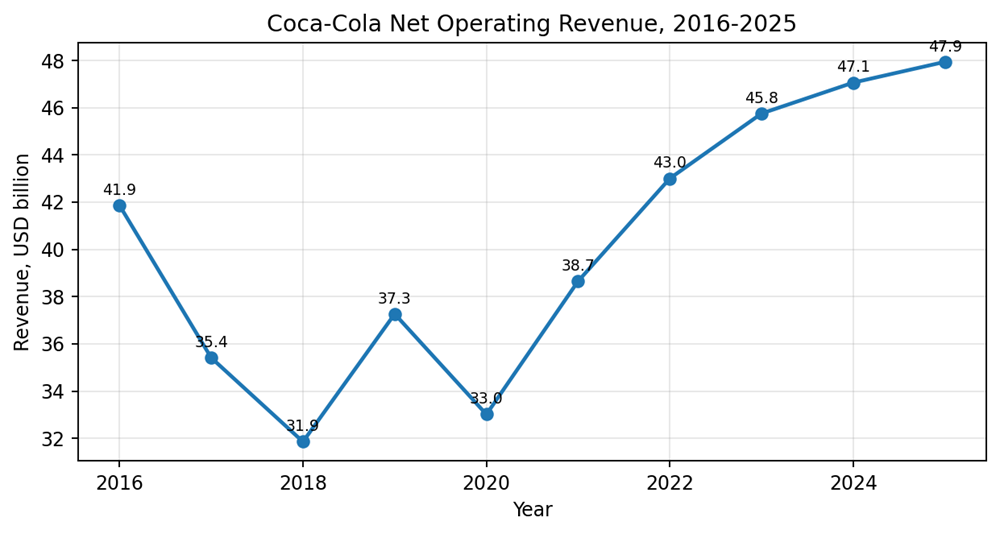
Coca-Cola net operating revenue trend, 2016 to 2025.
Coca-Cola’s revenue trend shows the effect of structural changes, pandemic disruption, and later recovery. Revenue declined during the refranchising period because several bottling operations moved out of consolidated revenue. The decline did not mean the brand weakened; it reflected a deliberate business model shift toward concentrate and syrup operations in several markets.
Revenue recovered after 2020 as away-from-home demand improved and pricing helped offset cost inflation. In 2025, net operating revenue increased to USD 47.941 billion, but the growth rate was more moderate than in earlier recovery years. The company reported a 4% favorable price/mix impact and a 1% consolidated volume benefit, while foreign currency and acquisitions or divestitures had negative effects.
The growth profile in 2026 is supported by product mix management, local market execution, low- and no-sugar innovation, revenue growth management, and packaging innovation. However, the company’s results remain exposed to currency changes, commodity costs, consumer spending pressure, and the performance of bottling partners.
|
Region / Segment |
2025 Third-Party Revenue |
Share of Company Revenue |
2025 Operating Income |
Comment |
|
North America |
USD 19.579 billion |
40.8% |
USD 5.070 billion |
Largest revenue region in 2025 |
|
EMEA |
USD 10.833 billion |
22.6% |
USD 4.298 billion |
Strong margin profile and broad country footprint |
|
Latin America |
USD 6.331 billion |
13.2% |
USD 3.742 billion |
High operating margin and strong local bottling execution |
|
Asia Pacific |
USD 5.328 billion |
11.1% |
USD 2.042 billion |
Large emerging market exposure, led by countries such as China and India |
|
Bottling Investments |
USD 5.726 billion |
12.0% |
USD 426 million |
Company-controlled bottling operations |
|
Corporate |
USD 144 million |
0.3% |
Not meaningful |
Corporate and other items |
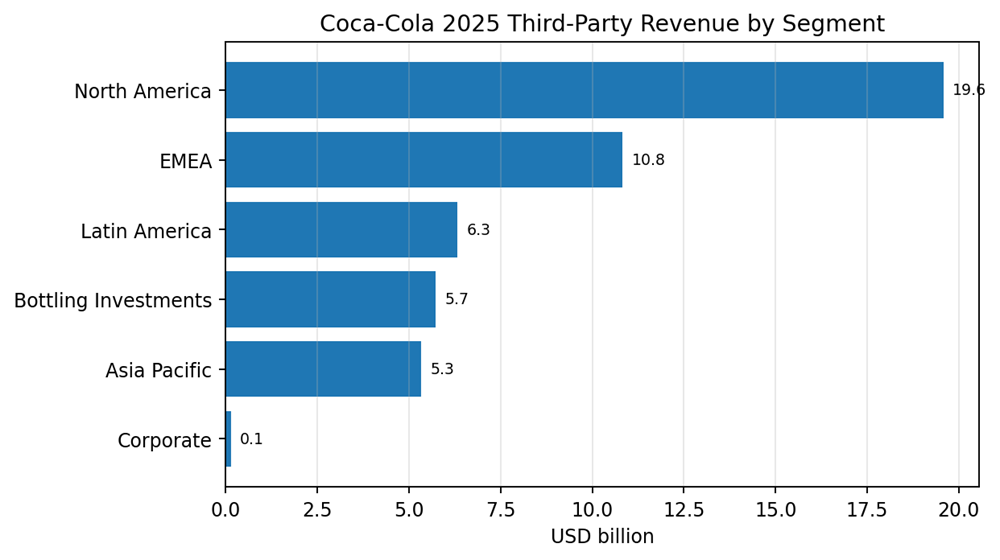
Coca-Cola 2025 third-party revenue by operating segment.
North America was Coca-Cola’s largest reported revenue region in 2025 because it includes a high-value market with strong retail, foodservice, convenience, and fountain channels. The region accounted for 40.8% of company net operating revenue and generated USD 19.579 billion in third-party revenue.
EMEA and Latin America remained important profit contributors. Latin America generated USD 3.742 billion in operating income on USD 6.331 billion of third-party revenue in 2025, reflecting a high margin structure. Asia Pacific showed lower reported revenue than North America and EMEA but remained strategically important because of large markets such as China and India.
|
Region / Segment |
Q1 2026 Reported Revenue Growth |
Q1 2026 Organic Revenue Growth |
Q1 2026 Unit Case Volume Growth |
|
EMEA |
+13% |
+11% |
+2% |
|
Latin America |
+14% |
+9% |
+1% |
|
North America |
+12% |
+12% |
+4% |
|
Asia Pacific |
+6% |
+5% |
+5% |
|
Bottling Investments |
+12% |
+10% |
+1% |
|
Consolidated |
+12% |
+10% |
+3% |
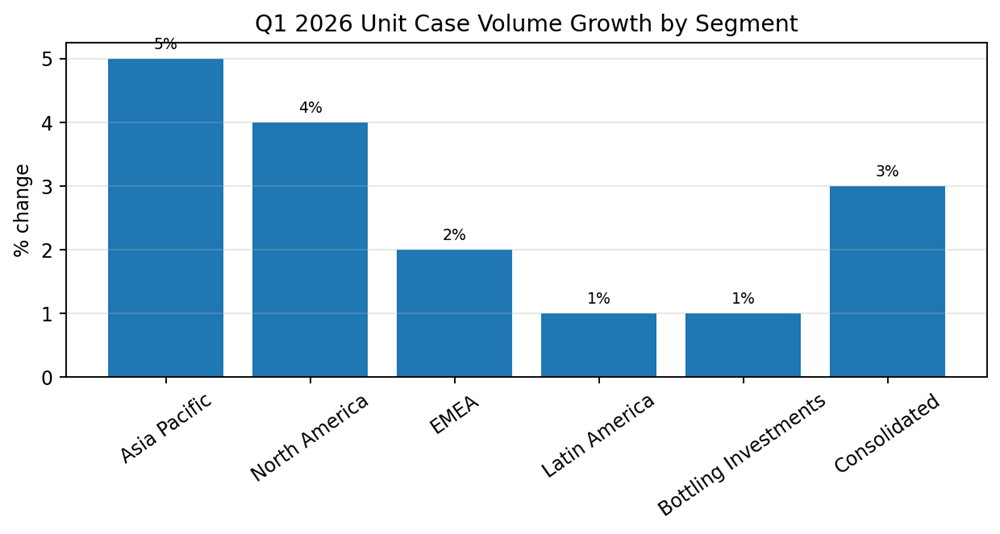
Q1 2026 Coca-Cola unit case volume growth by segment.
Coca-Cola’s product and service statistics show a company that remains anchored in sparkling soft drinks while increasing exposure to water, sports drinks, coffee, tea, juice, value-added dairy, plant-based drinks, and alcohol ready-to-drink products. Its portfolio structure allows the company to serve different consumption occasions, price points, and local market preferences.
|
Category |
Selected Brands / Products |
Role in Portfolio |
|
Trademark Coca-Cola |
Coca-Cola, Coca-Cola Zero Sugar, Diet Coke / Coca-Cola Light, and line extensions |
Core global trademark and large share of unit case volume |
|
Sparkling flavors |
Sprite, Fanta, Fresca, Schweppes, Thums Up, and other flavor brands |
Supports flavored carbonated soft drink demand |
|
Water, sports, coffee and tea |
Dasani, smartwater, Topo Chico, BODYARMOR, Powerade, Costa, Georgia, Gold Peak, Fuze Tea, Ayataka |
Expands presence beyond traditional carbonates |
|
Juice, dairy and plant-based |
Minute Maid, Simply, fairlife, innocent, Del Valle, AdeS, Core Power, Maaza |
Supports breakfast, nutrition, juice, dairy, and plant-based occasions |
|
Alcohol ready-to-drink |
Selected brands and partnerships such as Jack Daniel’s & Coca-Cola, Simply Spiked, Topo Chico Hard |
Selective category expansion where allowed by regulation |
|
Selected Product / Category |
Q1 2026 Volume Growth |
Comment |
|
Coca-Cola Zero Sugar |
+13% |
Strongest listed brand growth in the release |
|
Tea |
+8% |
Part of water, sports, coffee and tea category |
|
Diet Coke / Coca-Cola Light |
+6% |
Low-calorie trademark product growth |
|
Water |
+5% |
Supported category growth in hydration |
|
Sports drinks |
+3% |
Growth supported by brands such as BODYARMOR and Powerade |
|
Sparkling soft drinks |
+2% |
Core category growth in Q1 2026 |
|
Juice, value-added dairy and plant-based |
-1% |
Slight decline during the quarter |
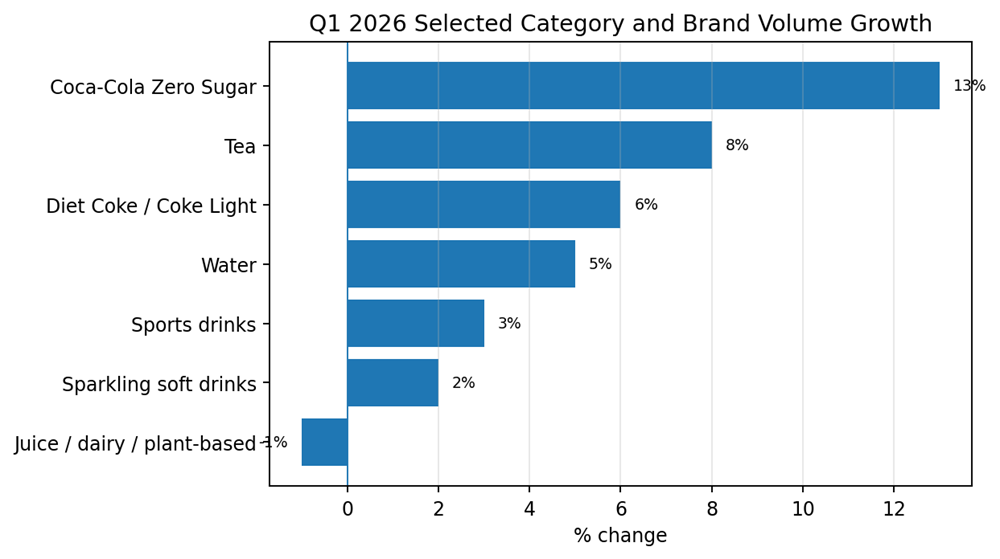
Selected Q1 2026 category and brand volume growth.
The sales data shows that Coca-Cola’s scale is not limited to finished beverage sales by the parent company. The company’s economic model is strongly linked to concentrate sales, bottling partner execution, package mix, local affordability, retail presence, and consumption occasions across both at-home and away-from-home channels.
Coca-Cola competes in a broad beverage market that includes carbonated soft drinks, flavored sparkling beverages, bottled water, sports drinks, coffee, tea, juices, dairy-based drinks, plant-based beverages, energy drinks, and alcohol ready-to-drink products. The company does not disclose a single global market share number in its annual filing because market share differs by country, channel, brand, and category. In Q1 2026, Coca-Cola stated that it gained value share in total nonalcoholic ready-to-drink beverages.
|
Company |
Industry Segment |
Strength |
Key Competition Area |
|
PepsiCo |
Carbonated soft drinks, sports drinks, snacks and beverages |
Pepsi, Mountain Dew, Gatorade, large retail relationships |
Carbonated soft drinks, sports drinks, convenience channels |
|
Keurig Dr Pepper |
Carbonated soft drinks, coffee systems and beverages |
Dr Pepper, Canada Dry, 7UP in certain markets, Keurig platform |
Flavored CSDs, coffee, retail shelf space |
|
Red Bull |
Energy drinks |
Strong global energy drink brand and event marketing |
Energy drinks and younger consumer occasions |
|
Monster Beverage |
Energy drinks |
Large energy drink portfolio and global distribution relationship with Coca-Cola in many markets |
Energy drink volume, retail visibility |
|
Nestle water brands |
Bottled water and premium hydration |
Global packaged water capability |
Water and premium hydration occasions |
|
Danone |
Water, dairy and plant-based beverages |
Strong health, dairy, water and nutrition presence |
Water, dairy, and plant-based beverage demand |
|
Private labels and local brands |
Value beverages and regional drinks |
Price competitiveness and local relevance |
Entry-price beverages and regional flavors |
Coca-Cola competes through brand strength, bottling reach, revenue growth management, packaging options, affordability packs, innovation in low- and no-sugar beverages, and strong execution across retail and away-from-home channels. The company’s broad geographic footprint creates resilience, but competition remains intense because local brands, private labels, and category specialists often compete aggressively on price, flavor, packaging, and channel access.
|
Holder |
Shares |
Ownership |
Notes |
|
Berkshire Hathaway |
400,000,000 |
9.30% |
Reported institutional ownership as of March 31, 2026 |
|
Vanguard Group |
377,551,819 |
8.78% |
Reported institutional ownership as of March 31, 2026 |
|
BlackRock |
331,833,691 |
7.71% |
Reported institutional ownership as of March 31, 2026 |
|
State Street |
167,222,395 |
3.89% |
Reported institutional ownership as of March 31, 2026 |
|
Geode Capital Management |
92,954,629 |
2.16% |
Reported institutional ownership as of March 31, 2026 |
Ownership statistics are useful for understanding Coca-Cola’s investor base. Large institutional shareholders hold meaningful positions, while Berkshire Hathaway remains one of the most visible long-term shareholders. Ownership provider figures can change each quarter as filings are updated, so the table should be read as a point-in-time view rather than a fixed ownership structure.
Innovation is expected to remain important because beverage companies must adapt to sugar reduction expectations, package-lighting goals, personalization, retail media, data-led supply chain planning, and faster product testing. For Coca-Cola, innovation is not limited to new flavors. It also covers packaging formats, consumer engagement, marketing technology, digital commerce, and bottling system execution.
|
Partner / Collaboration |
Area |
Statistic or Fact |
|
FIFA |
Sports sponsorship and global football engagement |
Formal association began in 1974; official FIFA World Cup sponsor since 1978; partnership extends through 2030 |
|
FIFA World Cup Trophy Tour |
Global fan engagement |
Ahead of the 2026 World Cup, the Trophy Tour covers 30 countries and 75 stops; since 2006, it has reached more than 4 million fans |
|
Microsoft |
Cloud, AI and productivity technology |
Five-year agreement valued at USD 1.1 billion announced in 2024 |
|
Coca-Cola HBC / CCBA transaction |
Bottling system restructuring in Africa |
Coca-Cola and Gutsche Family Investments agreed to sell a 75% controlling interest in CCBA to Coca-Cola HBC AG in 2025 |
|
Bottling partners |
Manufacturing, distribution and local market execution |
The Coca-Cola system includes more than 225 bottling partners globally |
|
Retail, foodservice and venue partners |
Channel distribution |
Supports at-home, away-from-home, fountain, convenience, restaurant, sports, and entertainment consumption occasions |
Partnerships remain central to Coca-Cola growth. The bottling partner system provides local production and distribution. Sponsorships provide consumer reach and brand visibility. Technology alliances support digital transformation and data-led execution. These collaborations allow Coca-Cola to operate as a global brand while still adapting to local markets.
Coca-Cola’s customer base covers individual consumers, retailers, foodservice operators, restaurants, convenience stores, supermarkets, entertainment venues, sports venues, and digital commerce channels. The company’s consumer reach is enhanced by global advertising, localized packaging, affordability initiatives, and channel-specific product formats such as mini-cans and single-serve packs.
Website traffic and social media figures are not audited company financial metrics. The data below should be read as third-party estimates or public profile counts. They are useful for understanding digital visibility, but they can change frequently.
|
Platform / Site |
Metric |
Latest Available Fact |
|
coca-cola.com |
Estimated website visits |
Similarweb reported 13.8 million visits across the last three months shown in April 2026; traffic increased 19.15% month over month |
|
coca-cola.com |
Engagement |
Estimated bounce rate was 35.1%, pages per visit were 3.85, and average visit duration was 00:01:12 |
|
coca-cola.com |
Top listed traffic source |
Organic Search was reported as the top source at 33.4% |
|
coca-cola.com |
Top listed countries |
United States 31.53%, Germany 5.38%, Mexico 4.91%, Brazil 4.67%, Japan 4.24% |
|
coca-colacompany.com |
Corporate website traffic |
Similarweb reported monthly traffic growth of 2.07%, bounce rate of 49.05%, and 2.84 pages per visit in April 2026 |
|
|
Corporate followers |
The Coca-Cola Company LinkedIn page showed about 9.0 million followers in 2026 search results |
|
YouTube |
Coca-Cola channel |
The Coca-Cola YouTube channel showed about 4.78 million subscribers and 868 videos |
|
|
@cocacola followers |
AltIndex reported about 3.3 million Instagram followers in 2026 |
|
TikTok |
Coca-Cola TikTok followers |
AltIndex reported about 3.6 million to 3.7 million TikTok followers in 2026 |
Coca-Cola’s digital footprint is broad because the brand uses product sites, corporate pages, regional sites, social platforms, sports and entertainment content, promotional campaigns, and consumer contests. Social media and web traffic are especially important for campaigns such as Share a Coke, limited-edition packaging, brand collaborations, and local market activations.
Coca-Cola employees are concentrated in corporate functions, concentrate operations, brand management, supply chain support, innovation, finance, human resources, legal, technology, and company-controlled bottling operations. The much larger Coca-Cola system workforce reflects bottling partner employees who manufacture, distribute, and sell finished beverages in local markets.
|
Year / Period |
Development |
Details |
|
2025 |
Global Ventures segment sunset |
Costa, innocent, and dogadan moved into EMEA, while related ready-to-drink and Monster fee activity moved to relevant geographies |
|
2025 |
Share a Coke returned |
The campaign returned with connected packaging and digital engagement designed for younger consumers |
|
2025 |
CCBA transaction announced |
Coca-Cola and Gutsche Family Investments agreed to sell a 75% controlling interest in Coca-Cola Beverages Africa to Coca-Cola HBC AG |
|
2026 |
CEO transition |
Henrique Braun became Chief Executive Officer on March 31, 2026, while James Quincey transitioned to Executive Chairman |
|
2026 |
Operational leadership changes |
Coca-Cola announced leadership changes to bring operations closer to consumers and speed technology adoption |
|
Q1 2026 |
Financial update |
Net revenues increased 12% to USD 12.5 billion, organic revenue increased 10%, and unit case volume increased 3% |
|
Q1 2026 |
Product and campaign activity |
The company reported AI-enabled packaging in China, Ramadan activations, Sprite growth in Brazil, March Madness marketing in the U.S., and lighter bottle formats in South Africa and India |
|
2026 |
FIFA World Cup activation |
The Trophy Tour ahead of the 2026 FIFA World Cup covers 30 countries and 75 stops |
Recent developments indicate that Coca-Cola is working on portfolio management, system restructuring, digital engagement, sports marketing, and operational simplification. The most important 2026 event is the CEO transition to Henrique Braun, which occurred at the same time as operating leadership changes designed to support consumer proximity and technology adoption.
The future outlook for Coca-Cola in 2026 is cautiously positive. Management guided for 4% to 5% organic revenue growth for the full year, supported by brand strength, price/mix management, emerging market reach, low- and no-sugar innovation, packaging changes, and channel execution. The company’s Q1 2026 growth showed that volume, pricing, and category expansion can contribute together when local execution is strong.
Digital transformation is expected to play a larger role in sales planning, consumer engagement, marketing production, supply chain decision-making, and productivity. Coca-Cola’s cloud and AI investment with Microsoft, along with its 2026 operational leadership changes, indicates that technology will be used to support faster market response and more efficient global operations.
Risks remain important. Currency movements, commodity costs, consumer spending pressure, packaging regulation, sugar-related policy, and competitive intensity can affect performance. Even with these pressures, Coca-Cola’s broad brand portfolio, bottling system, global reach, and cash generation provide a strong base for future Coca-Cola growth.
Coca-Cola remains one of the most important beverage companies in the world in 2026. The company generated USD 47.941 billion in fiscal year 2025 revenue, reported USD 13.107 billion in net income attributable to shareowners, and held USD 104.816 billion in total assets at year-end 2025. Its brands are sold across more than 200 countries and territories through a global system that includes more than 225 bottling partners.
The company’s 2026 position is supported by Q1 revenue growth, brand strength, global distribution, product innovation, and disciplined capital returns. Coca-Cola statistics also show several areas that need continued attention, including currency pressure, changing consumer preferences, sustainability requirements, packaging regulation, and competition across beverage categories. Overall, Coca-Cola’s scale, portfolio breadth, and global bottling network support a stable long-term outlook.

Market View Insights specializes in delivering comprehensive market research solutions across 120 industries.Detailed and insightful reports covering market trends, competitive analysis, consumer behavior, and more, providing valuable insights for informed decision-making.
 USA :India :
 sales@marketviewinsights.com
 +1-445-120-2050


 +1-445-120-2050


 Chemicals And Materials
 Consumer Goods
 Energy And Power
 Biotechnology
 Healthcare
 Medical Devices And Supplies
 Pharmaceuticals
 Food And Beverage
 Agriculture
 Automotive And Transportation
 Technology
 Semiconductors And Electronics
 Building And Construction
 Manufacturing
