
Jun 08, 2026
By Emily Martin
Netflix entered 2026 as one of the largest global streaming entertainment companies. Its core business remains paid subscription video, but the company is now also expanding advertising, live events, games, and new formats designed for both TV and mobile viewing.
In 2025, Netflix generated $45.18 billion in revenue and $10.98 billion in net income. In Q1 2026, revenue reached $12.25 billion, while the company guided for $50.7 billion to $51.7 billion in 2026 revenue. This shows that Netflix is moving from a subscriber-count growth story toward a revenue, operating margin, and engagement growth story.
Competition remains high in 2026. Netflix competes with Disney+, Amazon Prime Video, YouTube, Apple TV+, Max, Hulu, Peacock, Paramount+, social video, gaming, and traditional television. The company has responded by increasing content variety, using local-language titles, expanding its ad-supported plan, and investing in live programming and games.
| Field | Information |
|---|---|
| Company Name | Netflix, Inc. |
| Company Type | Public company |
| Founded | 1997 |
| Founders | Reed Hastings and Marc Randolph |
| Headquarters | Los Gatos, California, United States |
| CEO | Ted Sarandos and Greg Peters, Co-Chief Executive Officers |
| CFO | Spencer Neumann, Chief Financial Officer |
| Industry | Streaming entertainment, media, advertising, and digital entertainment |
| Stock Symbol | NASDAQ: NFLX |
| Revenue | $45.18 billion in 2025; 2026 guidance of $50.7 billion to $51.7 billion |
| Net Income | $10.98 billion in 2025; $5.28 billion in Q1 2026 |
| Total Assets | $55.60 billion as of December 31, 2025 |
| Number of Employees | Approximately 16,000 full-time employees as of December 31, 2025 |
| Paid Members or Latest Reported User Base | More than 325 million paid memberships reported in Q4 2025. Netflix no longer reports quarterly paid memberships. |
| Services | Subscription video streaming, ad-supported streaming plans, games, live events, licensed and original entertainment |
| Products | Netflix streaming plans, Netflix Ads Suite, Netflix Games, Netflix Top 10, Tudum, Open Connect delivery infrastructure |
| Key Competitors | YouTube, Amazon Prime Video, Disney+, Hulu, Max, Apple TV+, Paramount+, Peacock, regional streaming services, social video platforms, gaming, and linear TV |
| Geographic Presence | Available in more than 190 countries with content and services across many languages |
| Official Website | https://www.netflix.com |
|
Year |
Netflix Milestone |
|
1997 |
Netflix was founded by Reed Hastings and Marc Randolph in California. |
|
1998 |
Netflix launched as an online DVD rental service, using the internet to replace the traditional video store model. |
|
1999 |
The subscription DVD model was introduced, helping the company build repeat use and recurring revenue. |
|
2002 |
Netflix completed its IPO and listed on the Nasdaq under the ticker NFLX. |
|
2007 |
Netflix launched streaming, allowing members to watch selected titles online instead of waiting for DVDs. |
|
2010 |
International expansion began with Canada, which marked the first step outside the United States. |
|
2012 |
Netflix started building original programming as a strategic content pillar. |
|
2013 |
House of Cards and other early originals pushed Netflix into premium scripted entertainment. |
|
2016 |
Netflix expanded to more than 190 countries, creating a global platform for local and English-language entertainment. |
|
2021 |
Netflix entered games, adding mobile titles as part of a broader entertainment strategy. |
|
2022 |
Netflix launched its ad-supported plan in selected markets to reach more price-sensitive users and advertisers. |
|
2023 |
Paid sharing controls were rolled out more widely, changing how account sharing was monetized. |
|
2024 |
Netflix increased its focus on live programming, including sports entertainment and special event formats. |
|
2025 |
Netflix crossed 325 million paid memberships, reported more than $1.5 billion in ad revenue, and grew H2 viewing to 96 billion hours. |
|
2026 |
Netflix focused on higher ad monetization, AI-enhanced product features, cloud-first games, live events, and mobile-first formats. |
Netflix usage in 2026 is increasingly shaped by connected TV viewing, mobile consumption, binge watching, paid sharing, advertising-supported viewing, and live-event programming. Netflix does not publish a full public device split, so device-specific shares should be treated as latest official data not disclosed.
Netflix does not publish a full official public breakdown of users by age, gender, income, or household type in its SEC filings and shareholder letters. Therefore, this section uses the latest reliable survey and advertising-category information where available, while clearly marking unavailable figures.
|
User Attribute |
Latest Available Insight |
Data Status |
|
Age group |
U.S. survey evidence shows streaming is especially common among adults under 50. Pew reported that about 9 in 10 U.S. adults under 50 use streaming services. |
Survey data, 2025 |
|
Netflix U.S. reach |
Pew reported that 72% of U.S. adults say they ever watch programming on Netflix. |
Survey data, 2025 |
|
Gender |
Netflix does not disclose a full official gender split for its global user base. |
Latest official data not disclosed |
|
Income level |
Streaming use is common across income groups, but Netflix-specific global income split is not disclosed publicly. |
Latest official data not disclosed |
|
Household type |
Netflix advertising products include audience categories such as multi-generation families, empty nesters, household size, and family composition. |
Advertising category data |
|
Gen Z and Millennials |
Younger audiences are generally more likely to use streaming frequently than older adults, according to recent U.S. survey patterns. |
Survey-based trend |
|
Older users |
Streaming adoption is lower among older adults than younger adults, but still meaningful in the U.S. market. |
Survey-based trend |
Netflix revenue has expanded steadily since 2015. Growth has been supported by paid memberships, price adjustments, paid sharing, international expansion, stronger local-language content, and advertising. In 2026, Netflix guided for $50.7 billion to $51.7 billion in revenue, which would represent another year of double-digit growth if achieved.
|
Year |
Revenue |
Notes |
|
2015 |
$6.78B |
Actual annual revenue |
|
2016 |
$8.83B |
Actual annual revenue |
|
2017 |
$11.69B |
Actual annual revenue |
|
2018 |
$15.79B |
Actual annual revenue |
|
2019 |
$20.16B |
Actual annual revenue |
|
2020 |
$25.00B |
Actual annual revenue |
|
2021 |
$29.70B |
Actual annual revenue |
|
2022 |
$31.62B |
Actual annual revenue |
|
2023 |
$33.72B |
Actual annual revenue |
|
2024 |
$39.00B |
Actual annual revenue |
|
2025 |
$45.18B |
Actual annual revenue |
|
2026 |
$51.20B |
2026 guidance midpoint, not actual |
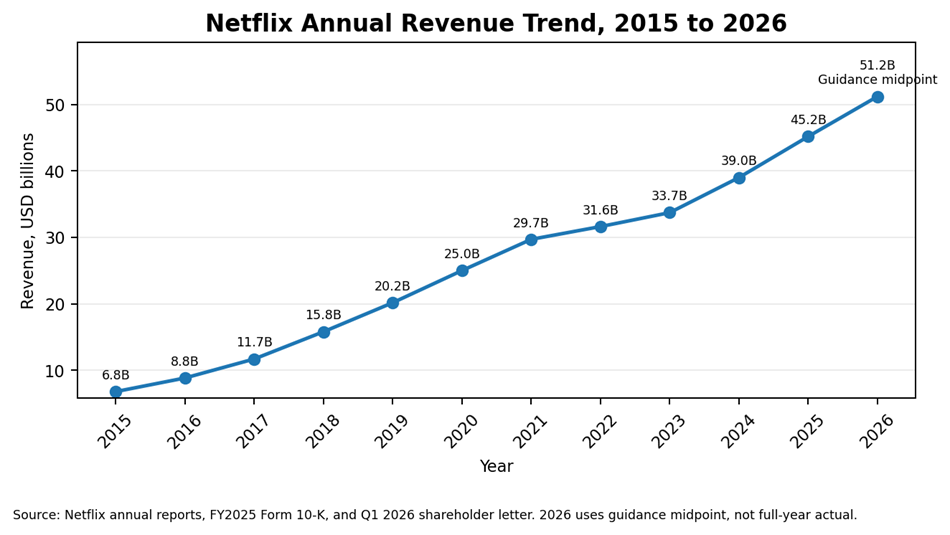
Netflix Annual Revenue Trend, 2015 to 2026
|
Quarter |
Revenue |
Status |
|
Q1 2025 |
$10.54B |
Actual |
|
Q2 2025 |
$11.08B |
Actual |
|
Q3 2025 |
$11.51B |
Actual |
|
Q4 2025 |
$12.05B |
Actual |
|
Q1 2026 |
$12.25B |
Actual |
|
Q2 2026 |
$12.57B |
Company forecast |
|
Region |
2025 Revenue |
Share of 2025 Revenue |
Comment |
|
United States and Canada |
$19.96B |
44.2% |
Largest revenue region |
|
Europe, Middle East, and Africa |
$14.51B |
32.1% |
Strong localization and scale |
|
Latin America |
$5.36B |
11.9% |
Pricing-sensitive but established region |
|
Asia-Pacific |
$5.35B |
11.8% |
Fastest 2025 growth among disclosed regions |
Average revenue per member, also called ARM, is no longer reported by Netflix as a quarterly metric. The company has stated that revenue and operating margin are now more useful measures because plan mix, extra member fees, advertising, and pricing can affect revenue without a one-to-one link to paid membership count.
Netflix profitability improved strongly through 2025. The operating margin reached 29.5% in 2025, compared with 26.7% in 2024. Q1 2026 operating margin was 32.3%, and the company guided for a 31.5% operating margin for full-year 2026.
|
Year |
Net Income |
|
2015 |
$0.12B |
|
2016 |
$0.19B |
|
2017 |
$0.56B |
|
2018 |
$1.21B |
|
2019 |
$1.87B |
|
2020 |
$2.76B |
|
2021 |
$5.12B |
|
2022 |
$4.49B |
|
2023 |
$5.41B |
|
2024 |
$8.71B |
|
2025 |
$10.98B |
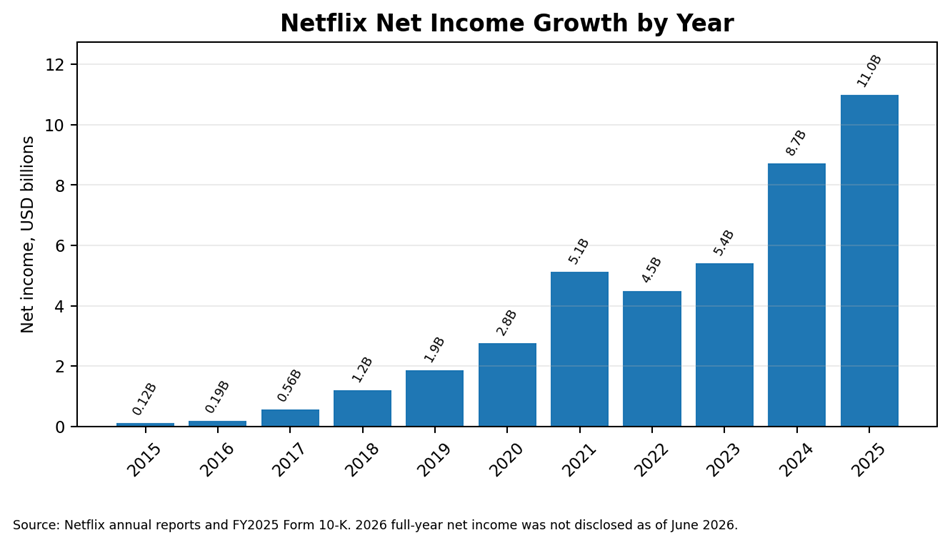
Netflix Net Income Growth by Year
Paid memberships remain an important historical measure, but Netflix has changed its reporting approach. The company crossed 325 million paid memberships in Q4 2025 and then stopped reporting quarterly membership totals as a regular metric. Future analysis should place greater emphasis on revenue, operating margin, engagement, and ad reach.
|
Year |
Paid Memberships |
Notes |
|
2015 |
74.8M |
Paid memberships |
|
2016 |
93.8M |
Paid memberships |
|
2017 |
117.6M |
Paid memberships |
|
2018 |
139.3M |
Paid memberships |
|
2019 |
167.1M |
Paid memberships |
|
2020 |
203.7M |
Paid memberships |
|
2021 |
221.8M |
Paid memberships |
|
2022 |
230.8M |
Paid memberships |
|
2023 |
260.3M |
Paid memberships |
|
2024 |
301.6M |
Paid memberships |
|
2025 |
325.0M+ |
Paid memberships |
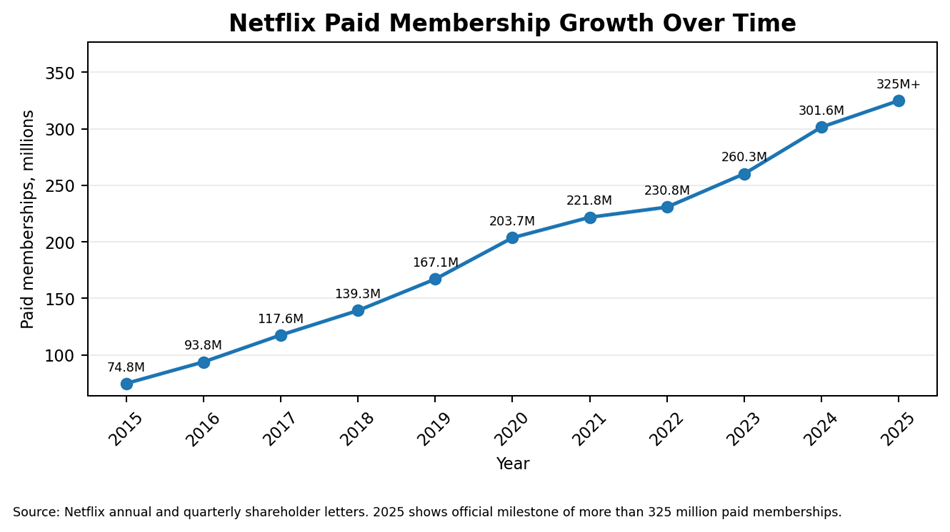
Netflix Paid Membership Growth Over Time
Advertising became one of Netflix's most important growth areas in 2025 and 2026. Netflix reported more than $1.5 billion in ad revenue in 2025 and expected ad revenue to roughly double in 2026. This indicates that advertising is becoming a larger revenue layer, although subscription revenue remains the core business.
The main advertising opportunity is higher monetization per viewer. Netflix already has broad global reach, strong brand safety controls, long viewing sessions, and premium content. The main risk is competition from ad-supported platforms with larger user bases, especially YouTube and Amazon Prime Video.
Password sharing became a major strategic shift for Netflix. The company no longer treats unmanaged shared access only as a usage problem. Instead, it has built paid sharing tools that support extra member sub-accounts and encourage account borrowers to become paying members.
The impact of password-sharing controls can be seen in Netflix's revenue strategy. The company can grow revenue by adding members, increasing plan prices, selling advertising, and monetizing users who previously shared accounts without payment.
Netflix Originals remain central to Netflix's global position. The strategy is based on a mix of English-language series, global films, documentaries, reality formats, Korean dramas, anime, Spanish-language series, Indian content, Japanese titles, and European productions.
Netflix films are a mix of original releases, licensed films, international productions, franchise extensions, and seasonal movies. The company uses film to support global reach, awards positioning, family viewing, and regional engagement.
|
Netflix Movie |
Views |
Notes |
|
KPop Demon Hunters |
325.1M views |
Most popular Netflix film on all-time Top 10 |
|
Red Notice |
230.9M views |
Action comedy, all-time Top 10 |
|
Carry-On |
172.1M views |
Thriller, all-time Top 10 |
|
Guillermo del Toro's Frankenstein |
102M views |
H2 2025 highlighted title |
|
A House of Dynamite |
78M views |
H2 2025 highlighted title |
|
Wake Up Dead Man |
66M views |
H2 2025 highlighted title |
|
Caramelo |
54M views |
Brazilian film, H2 2025 highlighted title |
|
Champagne Problems |
52M views |
H2 2025 highlighted title |
Licensed movies remain useful because they fill genre gaps, support engagement between original releases, and can attract older titles to new audiences. Original films remain important for brand identity, awards, and global marketing.
Netflix shows remain the strongest driver of repeat engagement. Returning series, reality shows, limited series, animation, documentaries, and non-English dramas all support long session times and frequent platform visits.
|
Netflix Show |
Views |
Notes |
|
Wednesday Season 2 |
About 124M views |
H2 2025 leading series based on Netflix engagement reporting |
|
Stranger Things Final Season |
120M views |
Major returning franchise in H2 2025 |
|
Emily in Paris Season 5 |
41M views |
Returning scripted franchise |
|
Nobody Wants This Season 2 |
31M views |
Returning series |
|
The Beast in Me |
48M views |
New show highlighted by Netflix |
|
The Asset |
24M views |
New show highlighted by Netflix |
|
Rulers of Fortune |
23M views |
Brazilian series |
|
Last Samurai Standing |
22M views |
Japanese series |
|
Selling Sunset Season 9 |
11M views |
Unscripted returning series |
|
Culinary Class Wars Season 2 |
10M views |
Korean unscripted title |
The show strategy is based on recurring franchises, local-market hits, limited series, documentaries, and reality formats. This supports a broad audience without relying on one genre or one country.
Netflix viewership reporting uses views, hours watched, weekly Top 10 appearances, and engagement reports. Netflix defines a view as hours viewed divided by runtime, which allows a long series and a short film to be compared more clearly than raw hours alone.
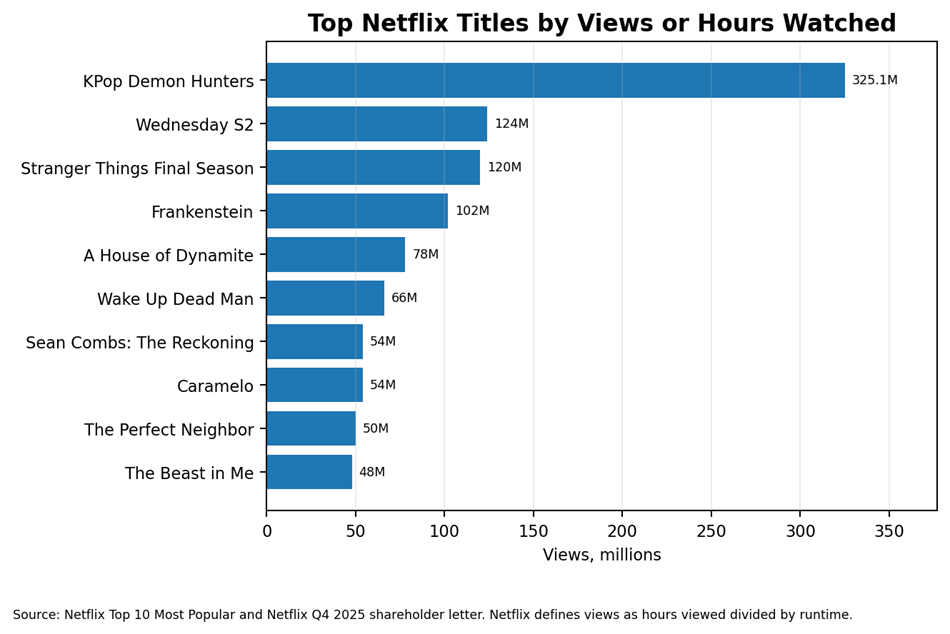
Top Netflix Titles by Views or Hours Watched
Streaming quality depends on the user's plan, device, internet connection, title availability, and regional rights. Netflix's delivery model is supported by a mix of cloud systems, data science, device partnerships, and Open Connect infrastructure.
Netflix Games is still a small but strategic part of the company. It is intended to increase engagement, strengthen family usage, support content franchises, and create entertainment formats that work beyond passive viewing.
The gaming outlook is cautiously positive. The business is unlikely to replace streaming revenue in the near term, but it can improve engagement, reduce churn among family households, and give Netflix more ways to use its intellectual property.
Awards remain important for Netflix because they support brand quality, talent relationships, and the long-term value of original films and series. The awards strategy also helps international titles reach a wider audience.
Netflix competes across subscription streaming, ad-supported streaming, live sports, creator video, social video, gaming, and traditional TV. User-base comparisons should be read carefully because platforms report different metrics. Netflix reports paid memberships, YouTube reports ad reach or users, Amazon often reports ad-supported reach, and some competitors have stopped disclosing subscriber counts.
|
Platform |
Latest User Base or Subscriber Base |
Ad Plan |
Content Strategy |
Competitive Strength |
|
Netflix |
325M+ paid memberships |
Yes |
Originals, licensed content, live events, games, ads |
Global scale, revenue growth, strong brand |
|
YouTube |
2.58B ad reach or active user estimate |
Yes |
Creator video, Shorts, live, TV-style creator content |
Largest video reach |
|
Amazon Prime Video |
315M monthly ad-supported viewers reported by company media coverage; Prime Video-only paid subscribers not disclosed |
Yes |
Streaming, sports, retail bundle, ads |
Bundled Prime ecosystem |
|
Disney+ and Hulu |
196M combined subscriptions at FY2025 year-end |
Yes |
Franchises, family, general entertainment, bundles |
Strong IP and bundle strategy |
|
Apple TV+ |
Latest official subscriber base not disclosed |
Limited markets |
Premium originals, device ecosystem |
High-value ecosystem, smaller disclosed scale |
|
Max / HBO Max |
140M+ streaming subscribers in Q1 2026 |
Yes |
HBO, Warner Bros., Discovery, sports and news add-ons |
Premium library and global rollout |
|
Hulu |
Included with Disney+ and Hulu combined reporting |
Yes |
General entertainment, FX, next-day TV, bundles |
Strong U.S. market position |
|
Paramount+ |
79.6M paid subscribers in Q1 2026 |
Yes |
CBS, sports, franchises, films, live events |
Sports and studio assets |
|
Peacock |
46M paid subscribers in Q1 2026 |
Yes |
NBCUniversal, sports, reality, news, films |
U.S. sports and event strength |
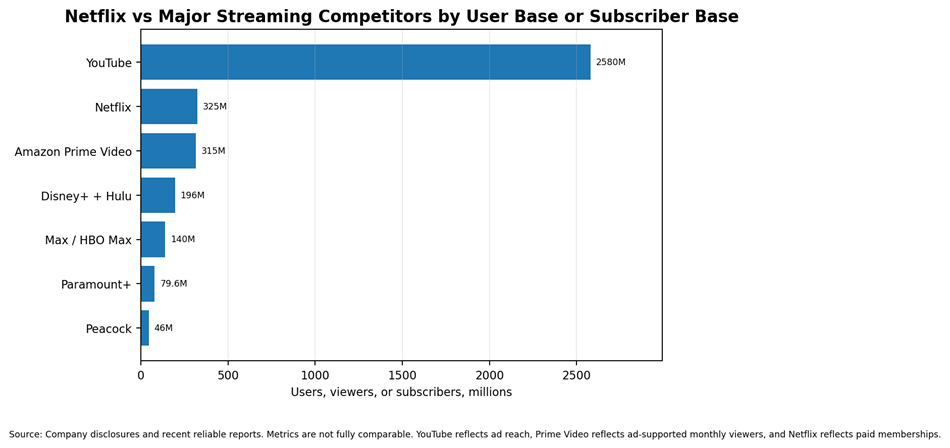
Netflix vs Major Streaming Competitors by User Base or Subscriber Base
The United States and Canada remain Netflix's largest revenue region. UCAN generated $19.96 billion in 2025 revenue and $5.25 billion in Q1 2026 revenue. Growth is being supported by pricing, paid sharing, ad-tier adoption, and strong connected TV usage. Competition is intense because the region has Disney+, Hulu, Amazon Prime Video, YouTube, Max, Peacock, Paramount+, Apple TV+, and traditional TV.
EMEA generated $14.51 billion in 2025 revenue and $4.00 billion in Q1 2026 revenue. Growth is supported by broad country coverage, local-language titles, sports entertainment, and price-plan diversity. The region is strategically important because it combines mature Western European markets with developing streaming adoption in other countries.
Latin America generated $5.36 billion in 2025 revenue and $1.50 billion in Q1 2026 revenue. The region remains price-sensitive, but Netflix benefits from early brand recognition, paid sharing monetization, mobile viewing, and local content. Brazil and Mexico remain important markets for both viewing scale and regional originals.
Asia-Pacific generated $5.35 billion in 2025 revenue and $1.51 billion in Q1 2026 revenue. The region offers long-term growth in India, Japan, South Korea, Southeast Asia, and Australia. Growth is supported by mobile-first viewing, lower-price plans, anime, Korean content, Japanese titles, Indian films and series, and local language investment.
|
Date |
Development |
Area |
|
January 2025 |
WWE Raw began its Netflix run in several markets, supporting the company's live programming strategy. |
Live events |
|
June 16, 2025 |
Netflix expanded programmatic ad availability with Yahoo DSP. |
Advertising |
|
November 5, 2025 |
Netflix said Netflix Ads Suite had been implemented across all 12 ad-supported countries and highlighted more than 190 million ad-supported monthly active viewers. |
Advertising |
|
Q4 2025 |
Netflix crossed 325 million paid memberships and reported 2025 ad revenue of more than $1.5 billion. |
Financial results |
|
January 2026 |
Netflix released Q4 2025 results and guided for $50.7 billion to $51.7 billion in 2026 revenue. |
Financial outlook |
|
March 4, 2026 |
Netflix expanded Ads Suite capabilities with additional audience, measurement, and buying tools. |
Advertising platform |
|
April 2026 |
Netflix launched Netflix Playground, a games app focused on younger children and family engagement. |
Gaming |
|
April 16, 2026 |
Netflix reported Q1 2026 revenue of $12.25 billion, operating margin of 32.3%, and net income of $5.28 billion. |
Financial results |
|
April 2026 |
Netflix acquired visual effects company InterPositive, strengthening internal technology and creative capabilities. |
Technology |
|
May 13, 2026 |
Netflix said its ad plan reached more than 250 million global monthly active viewers at Upfront 2026. |
Advertising |
Netflix's 2026 outlook is cautiously positive. The company has guided for $50.7 billion to $51.7 billion in revenue and a 31.5% operating margin. If delivered, this would show continued earnings strength even as competition remains high.
Netflix remains one of the most important companies in global streaming in 2026. The company has strong revenue scale, rising profitability, a global brand, a deep content library, and expanding capabilities in advertising, live events, and games.
The key change is that Netflix is no longer defined only by subscriber growth. Its 2026 performance is better measured by revenue, margin, engagement, ad reach, content efficiency, and global viewing share. Competition will remain intense, but Netflix enters 2026 with strong financial momentum and a broader entertainment strategy.
Market View Insights specializes in delivering comprehensive market research solutions across 120 industries.Detailed and insightful reports covering market trends, competitive analysis, consumer behavior, and more, providing valuable insights for informed decision-making.
 USA :India :
 sales@marketviewinsights.com
 +1-445-120-2050


 +1-445-120-2050


